
Rhythm Method Failure Rate How Reliable the Calendar Method Really Is
The real rhythm method failure rate is higher than most guides admit: around 9% a year with perfect use, and roughly 24% with typical use. Here’s the actual calendar-method calculation behind it, and why the gap between those two numbers is so wide.
The rhythm method failure rate is higher in practice than most guides let on. The method (also called the calendar method) estimates your fertile and safe days from past cycle lengths alone, without measuring anything happening in your body in real time, and that’s exactly where its accuracy problems come from.
The failure rate of this method is around 9% per year with perfect, consistent tracking. With typical use, how most people actually track it, that rises to roughly 24% per year, about 1 in 4 users. The gap between those two numbers, not the underlying math, is what makes this method riskier than most other contraception.
Key Takeaways
- The rhythm method failure rate is about 9% a year with perfect use and about 24% with typical use.
- Typical use means about 1 in 4 people become pregnant within a year.
- The calculation uses your shortest and longest cycles over the last six months.
- Irregular cycles, PCOS, breastfeeding and recent childbirth make it least reliable.
- It gives no protection against STIs.
How the Rhythm Method Actually Works
Subtract 18 from your shortest cycle and 11 from your longest cycle, count from day 1 of your last period, and the days between are your fertile window.
The Calculation
The calculation needs your shortest and longest cycle lengths from the last six months, not just an average. For a general overview of natural family planning, see the NHS guide to natural family planning:
- Subtract 18 from your shortest cycle length. Count that many days forward from the first day of your last period, that marks the start of your fertile (unsafe) window.
- Subtract 11 from your longest cycle length. Count that many days forward from the first day of your last period, that marks the end of your fertile window.
- Everything between those two dates counts as unsafe. Everything outside it counts as a safe day.
Worked Examples
Here is the result for three different pairs of shortest and longest cycles:
| Shortest cycle | Longest cycle | Fertile window starts (shortest minus 18) | Fertile window ends (longest minus 11) | Days outside the window |
|---|---|---|---|---|
| 26 days | 32 days | Day 8 | Day 21 | Days 1 to 7 and day 22 onward |
| 28 days | 28 days | Day 10 | Day 17 | Days 1 to 9 and day 18 onward |
| 25 days | 35 days | Day 7 | Day 24 | Days 1 to 6 and day 25 onward |
Notice how a wider gap between your shortest and longest cycle makes the unsafe window longer. Days outside the window are lower risk, never zero risk.
A Simpler Variant: The Standard Days Method
A simpler variant, the Standard Days Method, tested in an efficacy trial published in Contraception, skips the personal calculation and just marks days 8 through 19 as fertile, but only for cycles consistently between 26 and 32 days. If you’d rather not run either calculation by hand, our safe days calculator does it for you automatically. Worked examples are in how to calculate safe days, and the safe days chart shows the days for each cycle length from 21 to 35 days.
Rhythm Method, Calendar Method and Natural Family Planning
Rhythm and calendar method mean the same thing. Natural family planning is the wider label that also includes body signs.
Three Terms, One Idea
These terms overlap. The rhythm method and the calendar method are the same approach: counting days from past cycle lengths to estimate fertile and safe days. Natural family planning (NFP) is the wider label for fertility awareness, which also includes body signs such as temperature and cervical mucus. When a guide talks about calendar method safe days or rhythm method safe days, it means the days outside your estimated fertile window. See what safe days are for the full explanation. The Mayo Clinic describes the same shortest-minus-18, longest-minus-11 calculation.
| Term | What it means |
|---|---|
| Rhythm method | Estimating fertile days by counting from past cycle lengths |
| Calendar method | The same approach as the rhythm method |
| Natural family planning | The wider label for fertility awareness, including temperature and cervical mucus |
| Standard Days Method | Marks days 8 to 19 as fertile for cycles of 26 to 32 days |
How Effective Is It?
How effective and reliable is it? The numbers below answer that: the result depends far more on how consistently the method is followed than on the arithmetic. A review reports a Standard Days Method trial at 95% effective with perfect use and 88% with typical use (Malarcher et al., 2016), and the Global Handbook for Providers gives the same days 8 to 19 rule. To see lower-risk days for your own cycle, get your own estimate with the free calculator.
Perfect Use vs. Typical Use: Why One Number Isn’t Enough
Perfect use is about 9% failure a year. Typical use is about 24%. The gap shows how hard perfect use is to keep up.
The Two Definitions
The failure rate if every cycle is tracked precisely, the calculation is redone every month, and no unprotected sex happens during the calculated fertile window, ever, for a full year.
The failure rate for how people actually use it in real life: occasional tracking lapses, a slightly outdated cycle-length estimate, or a decision to take the risk on a borderline day.
The Two Numbers Side by Side
| Measure | Perfect use | Typical use |
|---|---|---|
| Failure rate per year | About 9% | About 24% |
| Out of 100 users in a year | About 9 pregnancies | About 24 pregnancies |
| What it requires | Tracking, recalculating and abstaining on every unsafe day | How people actually use it, with lapses |
The gap between those two numbers is unusually large for this method compared to most other contraception, which is exactly why quoting a single effectiveness percentage without specifying which one is misleading.
The Real Rhythm Method Failure Rate
About 1 in 4 people using the method in real life will become pregnant within a year, far higher than hormonal methods or IUDs.
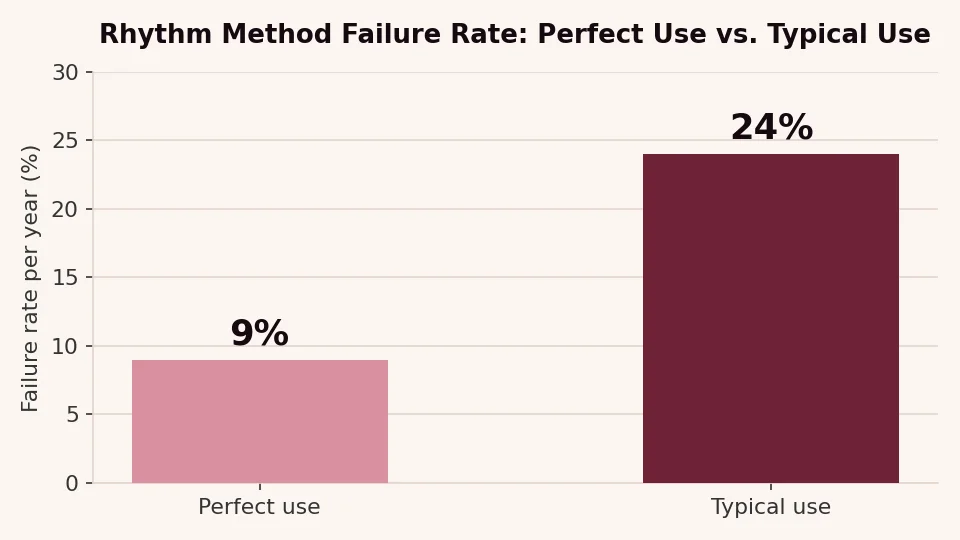
Perfect-use failure rate, per year
Typical-use failure rate, per year
Where the Numbers Come From
Per the most widely cited effectiveness data for fertility awareness-based methods, compiled in a landmark 2011 review published in Contraception, roughly 1 in 4 people relying on typical-use calendar tracking will experience an unintended pregnancy within a year, a meaningfully higher rate than hormonal methods, IUDs, or even typical-use condoms. The CDC’s own comparison of family planning methods places fertility awareness-based methods toward the less effective end of the spectrum for this reason.
What Perfect Use Really Requires
It’s worth being precise about what “9% perfect use” actually requires: recalculating your fertile window every single cycle from real tracked data, never guessing, with full abstinence or backup contraception on every day flagged as unsafe, for an entire year without a single lapse. Most of the gap between 9% and 24% comes down to how hard that standard is to sustain, not from the underlying math being wrong. For a plain-language answer, read how reliable safe days are for avoiding pregnancy.
Calendar Method vs. Standard Days Method
| Method | Perfect use | Typical use |
|---|---|---|
| Calendar (rhythm) method | About 9% failure | About 24% failure |
| Standard Days Method | About 5% failure (95% effective) | About 12% failure (88% effective) |
These figures come from different sources, so compare them as a rough guide, not as an exact ranking.
Why the Rhythm Method Fails More Than People Expect
Ovulation can shift, sperm survive up to five days and irregular cycles break the math.
Ovulation doesn’t run on a fixed schedule
The calculation assumes your future cycle will fall somewhere between your past shortest and longest cycle. Stress, illness, travel, sudden weight changes, and exercise intensity can all shift ovulation earlier or later than that range in any given month, exactly the scenario the calculation can’t see coming, since it only ever looks backward.
What Can Move Ovulation
- Stress
- Illness
- Travel
- Sudden weight changes
- Exercise intensity
Sperm survival extends the risk window
Sperm can survive inside the reproductive tract for up to five days. Sex several days before the calculated fertile window opens can still result in pregnancy if ovulation happens to arrive early that cycle, a risk the calendar method structurally can’t account for. See safe days after periods for how this plays out right after bleeding.
Irregular cycles undermine the math from the start
The wider the gap between your shortest and longest cycle, the wider your calculated unsafe window becomes, and the less confident you can be that it’s centered on your actual ovulation day. For irregular cycles specifically, the calendar method doesn’t just get less effective, it starts to break down as a concept, since it depends on a predictable pattern that isn’t there.
Least reliable for: people with irregular periods, PCOS, recent childbirth, active breastfeeding, thyroid conditions, or perimenopause, all conditions that specifically disrupt the cycle predictability the calculation depends on.
Does That Mean the Method Is Useless?
No. It lowers risk for people with steady cycles, and adding a physical sign improves it, but it is not as reliable as barrier or hormonal methods.
Not entirely, it’s a probability-lowering tool, not a pregnancy-preventing one. For people with very consistent cycles who track carefully and are comfortable with a real, non-trivial chance of pregnancy, it can meaningfully reduce risk compared to no tracking at all. It shouldn’t be described, or used, as if it carries the same reliability as a barrier or hormonal method.
Ways to Improve Accuracy
- Track at least six cycles before relying on the result.
- Recalculate every month, not once.
- Add a physical sign: basal body temperature, cervical mucus or an ovulation predictor kit.
- Use condoms for STI protection on every day of the cycle.
Using Physical Signs Alongside the Calendar
Combining the calendar estimate with a physical sign, basal body temperature, cervical mucus changes, or an ovulation predictor kit, measurably improves accuracy, since it stops relying on dates alone to catch a cycle that doesn’t follow the expected pattern. To see how a confirmed ovulation changes the picture, read safe days before and after ovulation. For the day-to-day estimate itself, our calculator for lower-risk days runs this same calculation for you and lays out your estimated safe and fertile days on a calendar. For a plain-language overview of which days are lower-risk, read what the safe period to have sex really means.
Frequently Asked Questions
9 questionsWhat is the rhythm method failure rate?
Why is the rhythm method less reliable than other contraception?
Is the rhythm method the same as the calendar method?
Does the rhythm method work with irregular periods?
Can I improve the rhythm method’s accuracy?
Does the rhythm method protect against STIs?
How do I calculate the rhythm method?
How many cycles do I need to track?
Is the rhythm method safe after childbirth, while breastfeeding or with PCOS?


Scientific References
- National Health Service (NHS). “Natural Family Planning (Fertility Awareness).” NHS UK. Accessed 2026. Effectiveness with correct and typical use, and who it may not suit, including people with irregular periods. nhs.uk
- Mayo Clinic. “Rhythm Method for Birth Control.” Mayo Clinic Tests & Procedures. Accessed 2026. The calendar method calculation (shortest cycle minus 18, longest minus 11), about 1 in 4 people becoming pregnant with typical use, and who it may not suit. mayoclinic.org
- Family Planning: A Global Handbook for Providers. “Fertility Awareness Methods: How to Use.” WHO / Johns Hopkins CCP / USAID. Accessed 2026. Standard Days Method: days 8 to 19 are fertile for cycles of 26 to 32 days; unprotected sex is acceptable on days 1 to 7 and from day 20. fphandbook.org
- Malarcher, Shawn, Jeff Spieler, Michal Fabic, et al. “Fertility Awareness Methods: Distinctive Modern Contraceptives.” Global Health: Science and Practice 4, no. 1 (2016): 13–15. Reports a Standard Days Method trial with 95% effectiveness in perfect use and 88% in typical use. pmc.ncbi.nlm.nih.gov
- Centers for Disease Control and Prevention (CDC). “Effectiveness of Family Planning Methods.” U.S. Medical Eligibility Criteria for Contraceptive Use. Accessed 2026. Comparative effectiveness of family planning methods, used for the typical-use failure figures. cdc.gov
- Centers for Disease Control and Prevention (CDC). “Standard Days Method.” U.S. Selected Practice Recommendations for Contraceptive Use. Accessed 2026. The days 8–19 rule and the 26–32 day cycle requirement. cdc.gov
- Arévalo, Marcos, Victoria Jennings, and Irit Sinai. “Efficacy of a New Method of Family Planning: The Standard Days Method.” Contraception 65, no. 5 (2002): 333–38. Pregnancy rates of about 5% with correct use and 12% with typical use over 13 cycles. doi.org
- Trussell, James. “Contraceptive Failure in the United States.” Contraception 83, no. 5 (2011): 397–404. Typical-use failure rate for fertility awareness-based methods. doi.org